OpenSearch Cluster Monitoring
One approach to instrumenting an OpenSearch cluster for monitoring purposes ...
Logfiles
Looking in logfiles for messages can be a difficult prospect as each node independently collects its own output, and the cluster scheduler can assign tasks to different nodes -- and you may not know which node a task is executing on. The solution is to collect all the logs in one place where they can be searched and correlated -- fortunately, there is a place to do that: OpenSearch itself. In an ideal world, there would be a separate cluster to monitor the main cluster -- so that if the main cluster is non-functional, you can analyze logs to identify the cause. Lacking that, the logs can be collected as part of the main cluster.
To accomplish this, install filebeat on each cluster node (or in a single place if logfiles are collected on a shared filesystem):
- Use the 'elasticsearch' module to collect the different log components (prefer JSON formats) and send to logstash
# Module: elasticsearch
# Docs: https://www.elastic.co/guide/en/beats/filebeat/7.15/filebeat-module-elasticsearch.html

- module: elasticsearch
  # Server log
  server:
    enabled: true
    # Set custom paths for the log files. If left empty,
    # Filebeat will choose the paths depending on your OS.
    var.paths:
      - /work/osdata/*/logs/*_server.json
  gc:
    enabled: false
    # Set custom paths for the log files. If left empty,
    # Filebeat will choose the paths depending on your OS.
    #var.paths:
  audit:
    enabled: false
    # Set custom paths for the log files. If left empty,
    # Filebeat will choose the paths depending on your OS.
    #var.paths:
  slowlog:
    enabled: true
    # Set custom paths for the log files. If left empty,
    # Filebeat will choose the paths depending on your OS.
    var.paths:
      - /work/osdata/*/logs/*_index_search_slowlog.json
      - /work/osdata/*/logs/*_index_indexing_slowlog.json
  deprecation:
    enabled: true
    # Set custom paths for the log files. If left empty,
    # Filebeat will choose the paths depending on your OS.
    var.paths:
      - /var/log/elasticsearch/*_deprecation.json  # JSON logs
Use a pipeline in logstash to parse the JSON into fields, using the logfile timestamp as the timestamp for the record:
input {
    beats {
        port => 5044
    }
}
filter {
  json {
    source => "message"
    remove_field => [ "message" ]
  }
  date {
    match => [ "timestamp", "ISO8601" ]
  }
}
output {
  opensearch {
      ssl => true
      ssl_certificate_verification => true
      cacert => "/etc/logstash/WilliamsNetCA.pem"
      keystore => "/etc/logstash/calormen.p12"
      keystore_password => "opensearch"
      hosts => ["https://poggin.williams.localnet:9200", "https://aravis.williams.localnet:9200", "https://lamppost.williams.localnet:9200"]
      index => "opensearch-logs-v1-calormen-%{+YYYY.MM.dd}"
  }
}
Cluster Status
Most of the information needed to monitor the status of the cluster is available through the _cat API, but it is rather difficult to get out and is not always very easy to interpret. Elastic developed a tool called Marvel for this purpose and later integrated it into the kibana dashboard/visualization tool. Other tools exist, but one open source tool implements at least some of the functionality of Marvel: Cerebro. Cerebro runs as a web application and queries the cluster's public API (port 9200). It displays the status of the nodes and the indices and provides an improved interface for accessing the rest of the API commands and interpreting the results in a more readable manner.
Cerebro can be configured to automatically connect to the target cluster, or allow connections to multiple clusters. Authentication is primitive; HTTP Basic Authentication is available for the Cerebro user interface, and authentication to the cluster can use either basic or certificate authentication methods.
Installation methods include RPM/DEB for package management or tarball. Configuration (including setting authentication methods for both users and clusters) is done by editing the configuration file at /etc/cerebro/application.conf.
Dashboards
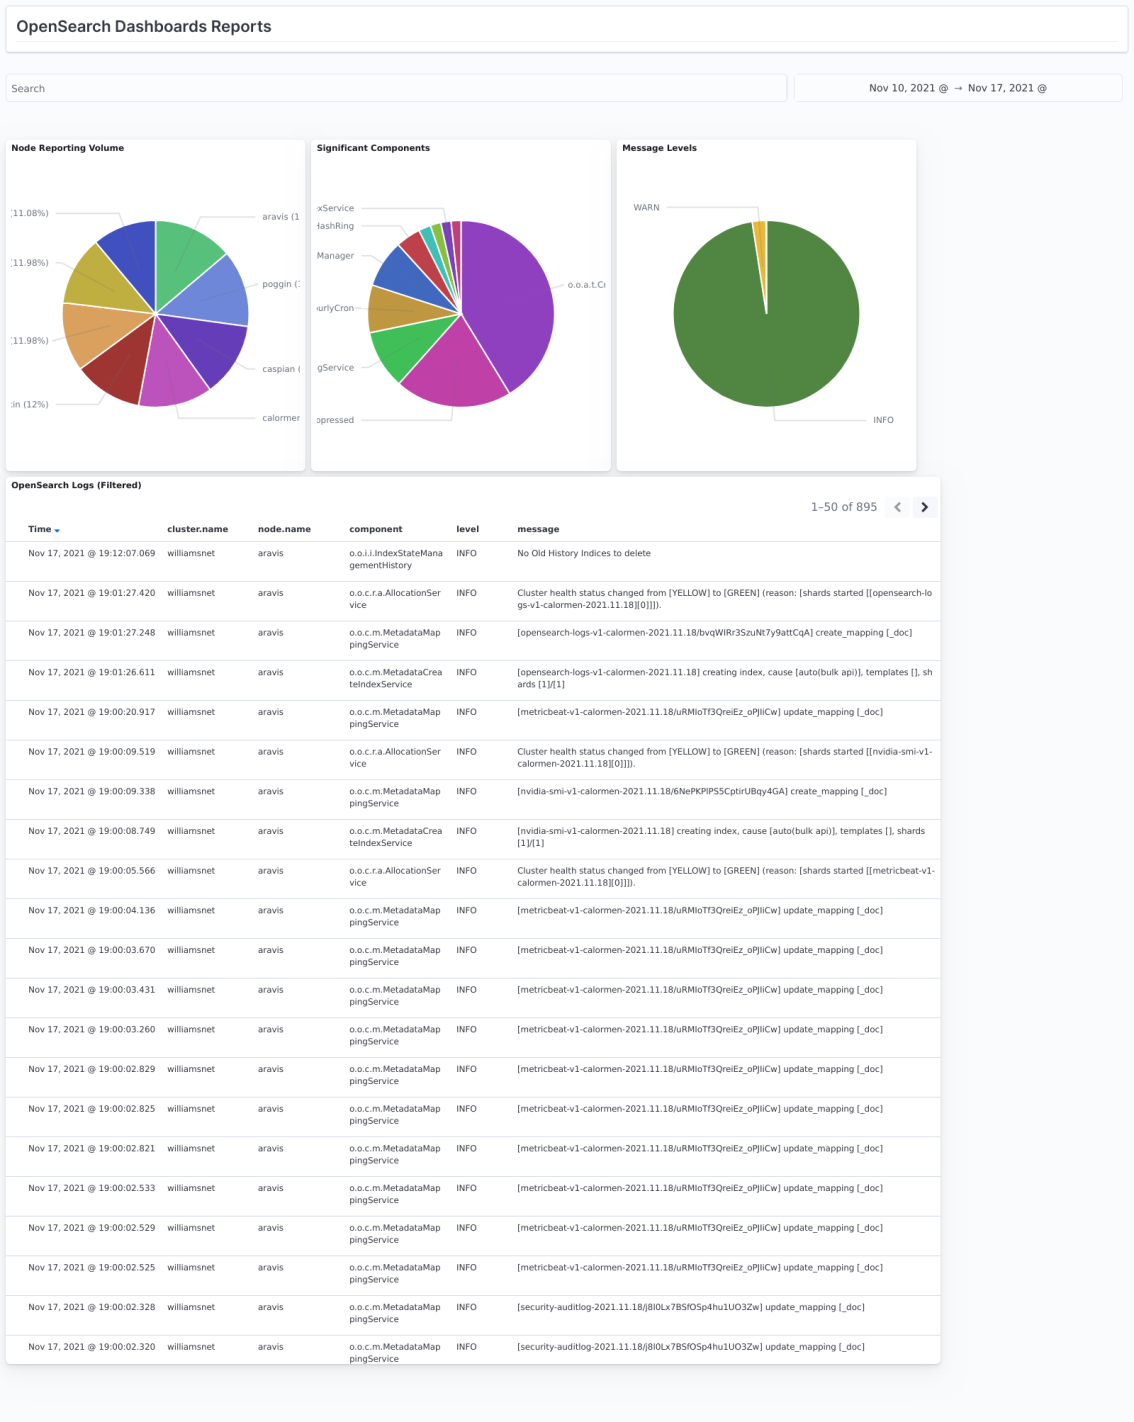
Simple dashboards can be created to visualize the logfiles

- Use a pipeline in logstash to parse the JSON into fields, using the logfile timestamp as the timestamp for the record.